Following 40 straight quarters of annual growth, nationwide housing prices spiked to the highest level since the Federal Housing Finance Agency started its tracking in 1991.
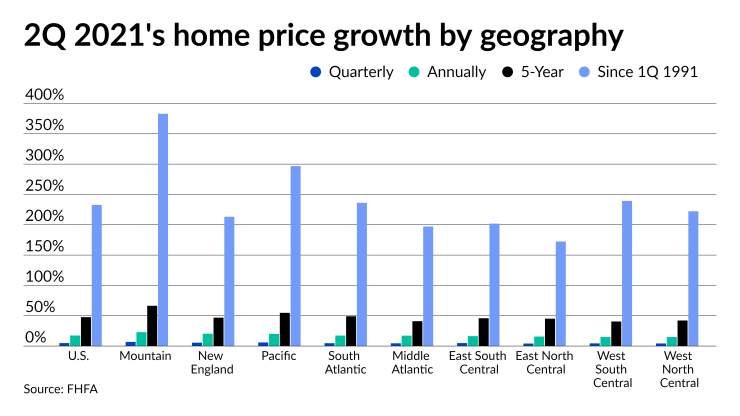
Single-family property values jumped in the second quarter by 17.42% annually, 4.92% quarterly and 1.6% in June from May, according to the agency’s Home Price Index. Additionally, overall price growth totaled 47.66% and 232.71% over the past five years and 30 years, respectively.
Broken down by the nine census divisions and the 100 largest metro areas, yearly gains in the Mountain, New England, and Pacific geographies and the top 20 cities surpassed the average growth for the record-setting quarter, shooting above 20%, FHFA Deputy Director of Research and Statistics Lynn Fisher said in the report.

The Mountain region — Arizona, Colorado, Idaho, Montana, Nevada, New Mexico, Utah, Wyoming —
Meanwhile, the West North Central — Iowa, Kansas, Minnesota, Missouri, Nebraska, North Dakota and South Dakota — had the lowest appreciation at 4.29%, 14.9%, 42.13% and 222.22%. The region finished just above the West South Central — Arkansas, Louisiana, Oklahoma, Texas — gains of 4.42%, 14.98%, 40.48% and 239.35%.
The extremely tight supply of for-sale homes continues to drive prices skyward. If the typical seasonal decline in listings from summer to fall holds, price growth could stay on the same trajectory, according to Finance of America Mortgage President Bill Dallas.
“
“
At the state level, Idaho led with a 37.06% jump from the second quarter of 2020. Utah’s 28.26%, Arizona’s 23.91%, Montana’s 23.73% and Rhode Island’s 23.66% rounded out the top five. On the flip side, Alaska posted the lowest annual gain of 8.17%, followed by 8.66% in North Dakota, 9.57% in Louisiana, 11.43% in Mississippi and 11.54% in Iowa.


