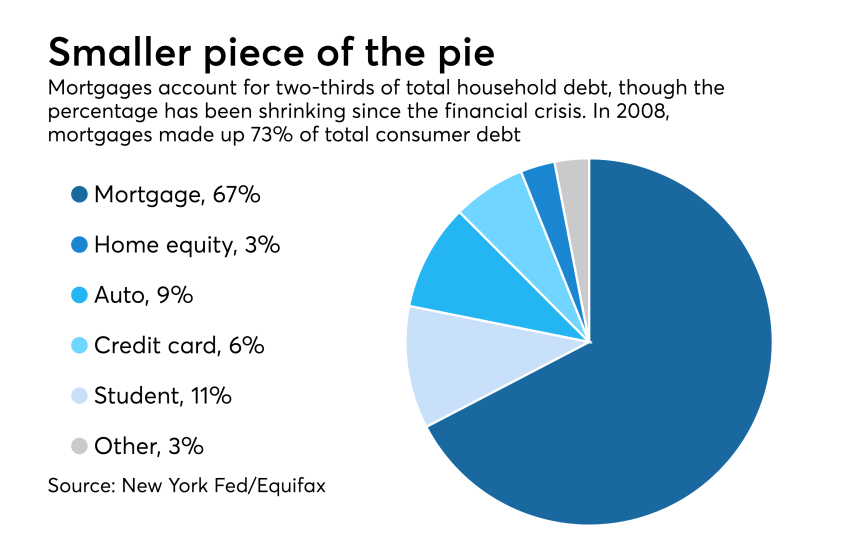
While student, auto and credit card balances are at or near record levels, housing debt is shrinking, credit quality is weakening a bit and lending standards, at least in some sectors, are tightening. What it all portends for consumer lending in 2019 is anyone's guess, but one thing is clear: Overextended borrowers can't definitively count on tax refunds to bail them out this year.

The pace of growth is slowing
The Federal Reserve Bank of New York said
Yet total debt climbed just 3% year over year, compared to 4.5% in 2017, and was up just 0.2% from the prior quarter, versus an increase of 1.6% between the second and third quarters. Quarter-over-quarter loan growth had not been that weak since mid-2015.
The pace of growth slowed because origination volume declined in several categories, reflecting both softening demand and somewhat stricter underwriting. (See slide three.)
What’s hard to know is if the fourth-quarter slowdown was a seasonal blip or a sign of
In a research note commenting on the Fed data, Moody’s Investors Services it expects loan growth to “pick up a bit” in the coming quarters, “given the solid employment market and high consumer confidence.”
But some economists say consumer confidence is actually weakening, and if that’s the case, consumer loan borrowing — after growing steadily for years — could level off or even decline in the coming quarters.
Dan Geller, a behavioral economist at the San Francisco research firm Analyticom, said that while consumers are generally less anxious about money than they were a year or two ago, his data shows that consumer confidence has slipped in recent months. He also pointed to a recent decline in retail sales as evidence that consumers are becoming slightly more skittish about borrowing and spending.
“Our published research in behavioral economics found that action speaks sooner than words,” Geller told American Banker. “In December of 2018, people started cutting back on spending, which reduced retail sales by 1.2%. Soon, other economic indicators will be slowing down as well.”

Per-capita debt also jumped, but remains manageable
However, average household debt is still below the pre-crisis high of $53,000, according to the New York Fed.
The good news for banks is that consumers are, by and large, keeping up with their loan payments. Though delinquencies have been ticking up of late (see charts four and five), they remain near historic lows in most categories because U.S. employment is strong and household wages are increasing modestly. Recent data from the Federal Reserve Bank of St. Louis shows that household income climbed 3.7% between the third quarter of 2017 and the third quarter of 2018. (Fourth quarter data is not yet available.)
The New York Fed also examined debt levels in 11 of the country’s most populous states, Arizona, California, Florida, Illinois, Michigan, New Jersey, New York, Ohio, Pennsylvania and Texas. Among those states, California had the highest average debt per household, at $71,470 in the fourth quarter while Michigan had the lowest, at $37,190.
Yet while Californians are carrying the most debt, they don’t seem to be having much trouble keeping up with their payments. Of the 11 states, California had the lowest level of seriously delinquent loans at 1.85%, while Florida had the highest percentage at 4.28%. The national average was 3.1%.

Non-mortgage debt driving growth
With interest rates rising and lending standards tightening a bit, mortgage originations in the quarter fell 11% in the quarter from three months earlier, to $401.5 billion. It was the weakest quarter for originations since the first quarter of 2016, according to the New York Fed’s data.
Meanwhile, student, auto and credit card debt continue to surge. Student and car loan balances hit record highs again in the fourth quarter and credit card balances, at $870 billion, are once again at pre-financial-crisis levels.
That said, growth did stall somewhat in the fourth quarter. Auto loan originations, while up year over year, fell 8.4% from three months earlier, to $144.3 billion. Student loan balances, which grew it a 2.1% clip in the third quarter, rose less than 1.4% in the fourth quarter.
In auto lending in particular, the decline in originations could be due to tightening lending standards.
The percentage of card loans made to borrowers with credit scores below 620 fell to 19.3%, compared to 20.7% in the third quarter and 21.3% in the second quarter. There have been some quarters in recent years when as many as one-fourth of all car loans were made to borrowers with sub-620 scores.

Auto lending in the ‘red zone’
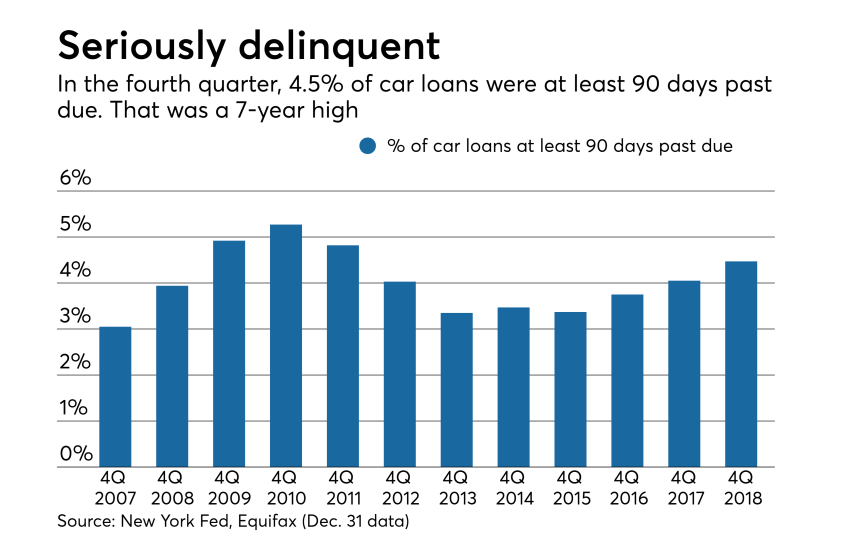
In the fourth quarter, 4.5% of all car loans were at least 90 days past due, the highest level in seven years, according to the New York Fed. Put another way, a record 7 million borrowers were least 90 days past due on their car loans, or 1 million more that were past due in 2010, when delinquency levels were at all-time highs.
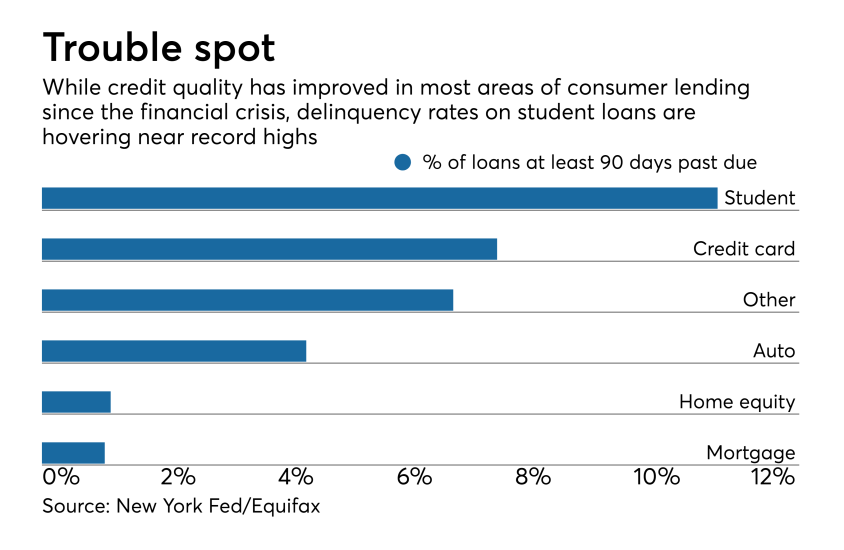
Ninety-day delinquencies on credit cards declined from the prior quarter, but were up 22 basis points year over year to 7.77%.
Moody’s said in its research note that with credit card delinquencies near historic lows, lenders could look to take a bit more risk in 2019 in an effort to gain more market share.
“Given the solid employment market, high consumer confidence, increased competition from both existing card issuers and several new entrants, and strong profitability reported by banks’ credit card segments, we expect credit card lenders to further modestly loosen underwriting standards,” Moody’s wrote.
Moody’s is more bearish on auto lending. It said that charge-offs, while still below historic highs, “should be much lower given the strong employment market” and suggested that many more loans made in the years following the financial crisis remain at risk of default.
“Over the last two years, auto loan underwriting has tightened and loan growth has slowed, a credit positive,” Moody’s wrote. “That said, we expect the weaker underwriting standards seen post-crisis to keep economic adjusted [loan] performance in the red zone.”

Is student debt also to blame?
A large percentage of borrowers who are at least 90 days past due on car payments are between 18 and 39, and it’s this group that holds nearly 60% of the outstanding $1.46 trillion in student debt.
As the cost of education has ballooned — student debt has more than doubled in just nine years — many borrowers have struggled to keep up with payments.
Ninety-day delinquencies on student loans first hit double digits in the third quarter of 2013 and have hovered between 10.7% and 11.8% in every quarter since. They ended 2018 at 11.42%.

Tax refunds may not bail out overextended borrowers this time
The Internal Revenue Service and tax preparers are warning that refunds could be considerably smaller this year thanks to the passage of the Tax Cuts and Jobs Act in late 2017. Among tax returns it has already processed, the IRS says that average refunds are down by roughly 8% from last year, to about $1,865 and that the number of people who received refunds through the same period last year had declined by roughly 25%.
There are two reasons why refunds are smaller this year — new caps on deductions, particularly deductions on property taxes, and changes in withholdings that resulted in fatter paychecks but also left many households owing more to the IRS at the end of the year.
And given that many people wait until the last minute to file their returns, expect the gap between what households received last year and what they’ll receive this year to widen even more. The Government Accountability Office has warned that millions of filers who received refunds last year will not get them in 2019. Millions more who received refunds could also end up owing, the GAO said.


